This week’s tip continues discussing the Analysis phase of FRACAS, specifically the different types of analysis tools which can be used to help determine the root cause. Last week’s tip talked about Graphical Analysis. We’ll focus this week on the Cause and Effect Diagram, also known as the Fishbone or Ishikawa Diagram.
Fishbone Diagram
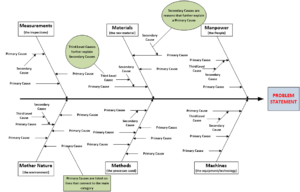
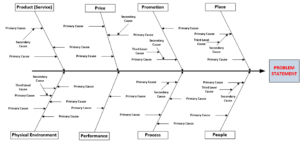
The Fishbone Diagram is a tool that’s used to categorize possible causes to a problem (failure). It’s best used in a team environment and is a structured approach, using brainstorming to put possible causes into useful categories. There are a number of common models, and variations that exist which help categorize the causes. Figures 1 and 2 illustrate two (2) common models that can be used to help solve an equipment/manufacturing-related problem or a process/service-related problem. You can use the examples below, select and/or combine some of the categories from the examples below, or you can create whatever categories you want. Key points to remember when using the Fishbone Diagram:
- Select categories to help you organize the potential causes that you come up with through brainstorming.
- Always start with a well-defined Problem Statement.
- Don’t get caught up in analysis paralysis. You could list potential causes forever, but if you, the team or the organization have no control or influence over the cause then it’s probably a waste of time to list it.
- If the root cause isn’t obvious, narrow the possible causes down to the top 3 to 5, and then use the 5-Why Technique.

Figure 1: Common model variation that can be used for equipment/manufacturing-related problems

Figure 2: Common model variation that can be used for process/service-related problems
The Cause and Effect (Fishbone) Diagram can be a very effective tool in certain situations. I’ve used it in the past on several occasions to help solve more complex manufacturing and process-related problems. In next week’s tip, we’ll finish up with Analysis tools by covering Fault Tree Analysis (FTA), Failure Mode Effects and Criticality Analysis (FMECA) and Process Failure Mode Effects and Criticality Analysis (PFMECA).
© 2017 by LinRich Solutions, LLC. All rights reserved


